OpenData Aachen - Parking Fines
The city of Aachen has been running an open data portal for some years now. The goal is to make data that is collected by the city such as general information about the city (streets, facilities, …) or the residents (common names, deaths, …) accessible to the interested public. Since November 2020 the project is also active on twitter under the @opendataaachen handle. This is how I became aware of the project. From time to time they publish new and interesting datasets, which I enjoy taking a look at. I always wanted to write a post about it, so here it is.
About a week ago they announced a new dataset on twitter - “Parking Fines issued in 2020”. Interesting I thought! Especially since I got my first and only parking fine last year, I wonder if I can find myself in there…
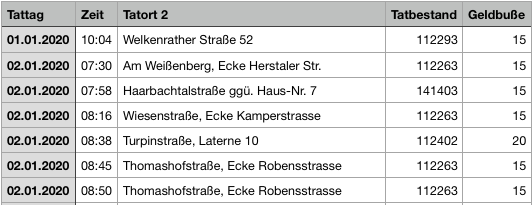
The data structure is very straightfoward, we have a CSV with 164,493 rows (fines) where each row consist of several different properties. From left to right we have:
- Day - dd.mm.yyyy
- Time - HH:mm
- Crime Scene - A natural language description of the location
- Offense - The type of fine that was issued
- Fine amount - €
For my first endeavour I could therefore simply filter the crime scene with the street in which I got the fine. This returned a few results. I expected this, because it is a really nasty corner in which you can almost fit inside the parking area but not completely… Anyway, using the date and fine amount I was able to locate my offense.
Thinking back to that nasty corner, I now thought that there must be more locations throughout the city that receive an excessive amount parking fines. Just plot the fines on a map I thought! But this is where it gets a bit tricky: Since the location information is a free text field and no latitude/longitude information is included, we first have to get a location for each offense.
This is worsened by the fact, that the personel from the “Ordnungsamt” does not seem to adhere to any standards regarding this field. Sometimes there is a street name with a house number, sometimes a combination of two streets (intersection), a street name and a street lamp number, or even a dscription such as “across the bakery”.
“Komphausbadstraße, Laterne 10 ggü. Haus-Nr.”
My first thought was to reuse some code from an old project, that queries the Apple Maps servers with a natural language request. Perfect! But while this was working very well, I quickly realized that Apple would probably not be too happy to receive 160,000 request from a single source within a few seconds. And I was right, after a few queries my requests got refused and I could not continue. After fiddling around with different delays for a while, I figured that with the delay of one second, which was working, it would take 44 hours for the whole thing to complete. So back to the drawing board…
I then remembered a recent project which uses the Openstreetmap data of Aachen. I should probably write a post about that project too, as it is really exciting! But for now let’s not get distracted. What I already had from that project, were all streets of Aachen (including their name) in a suitable format. Great! For each parking fine, I could now simply go through all streets of Aachen and see if there is a match between the description of the fine location and a street name. If a match is found, I simply increase a counter.
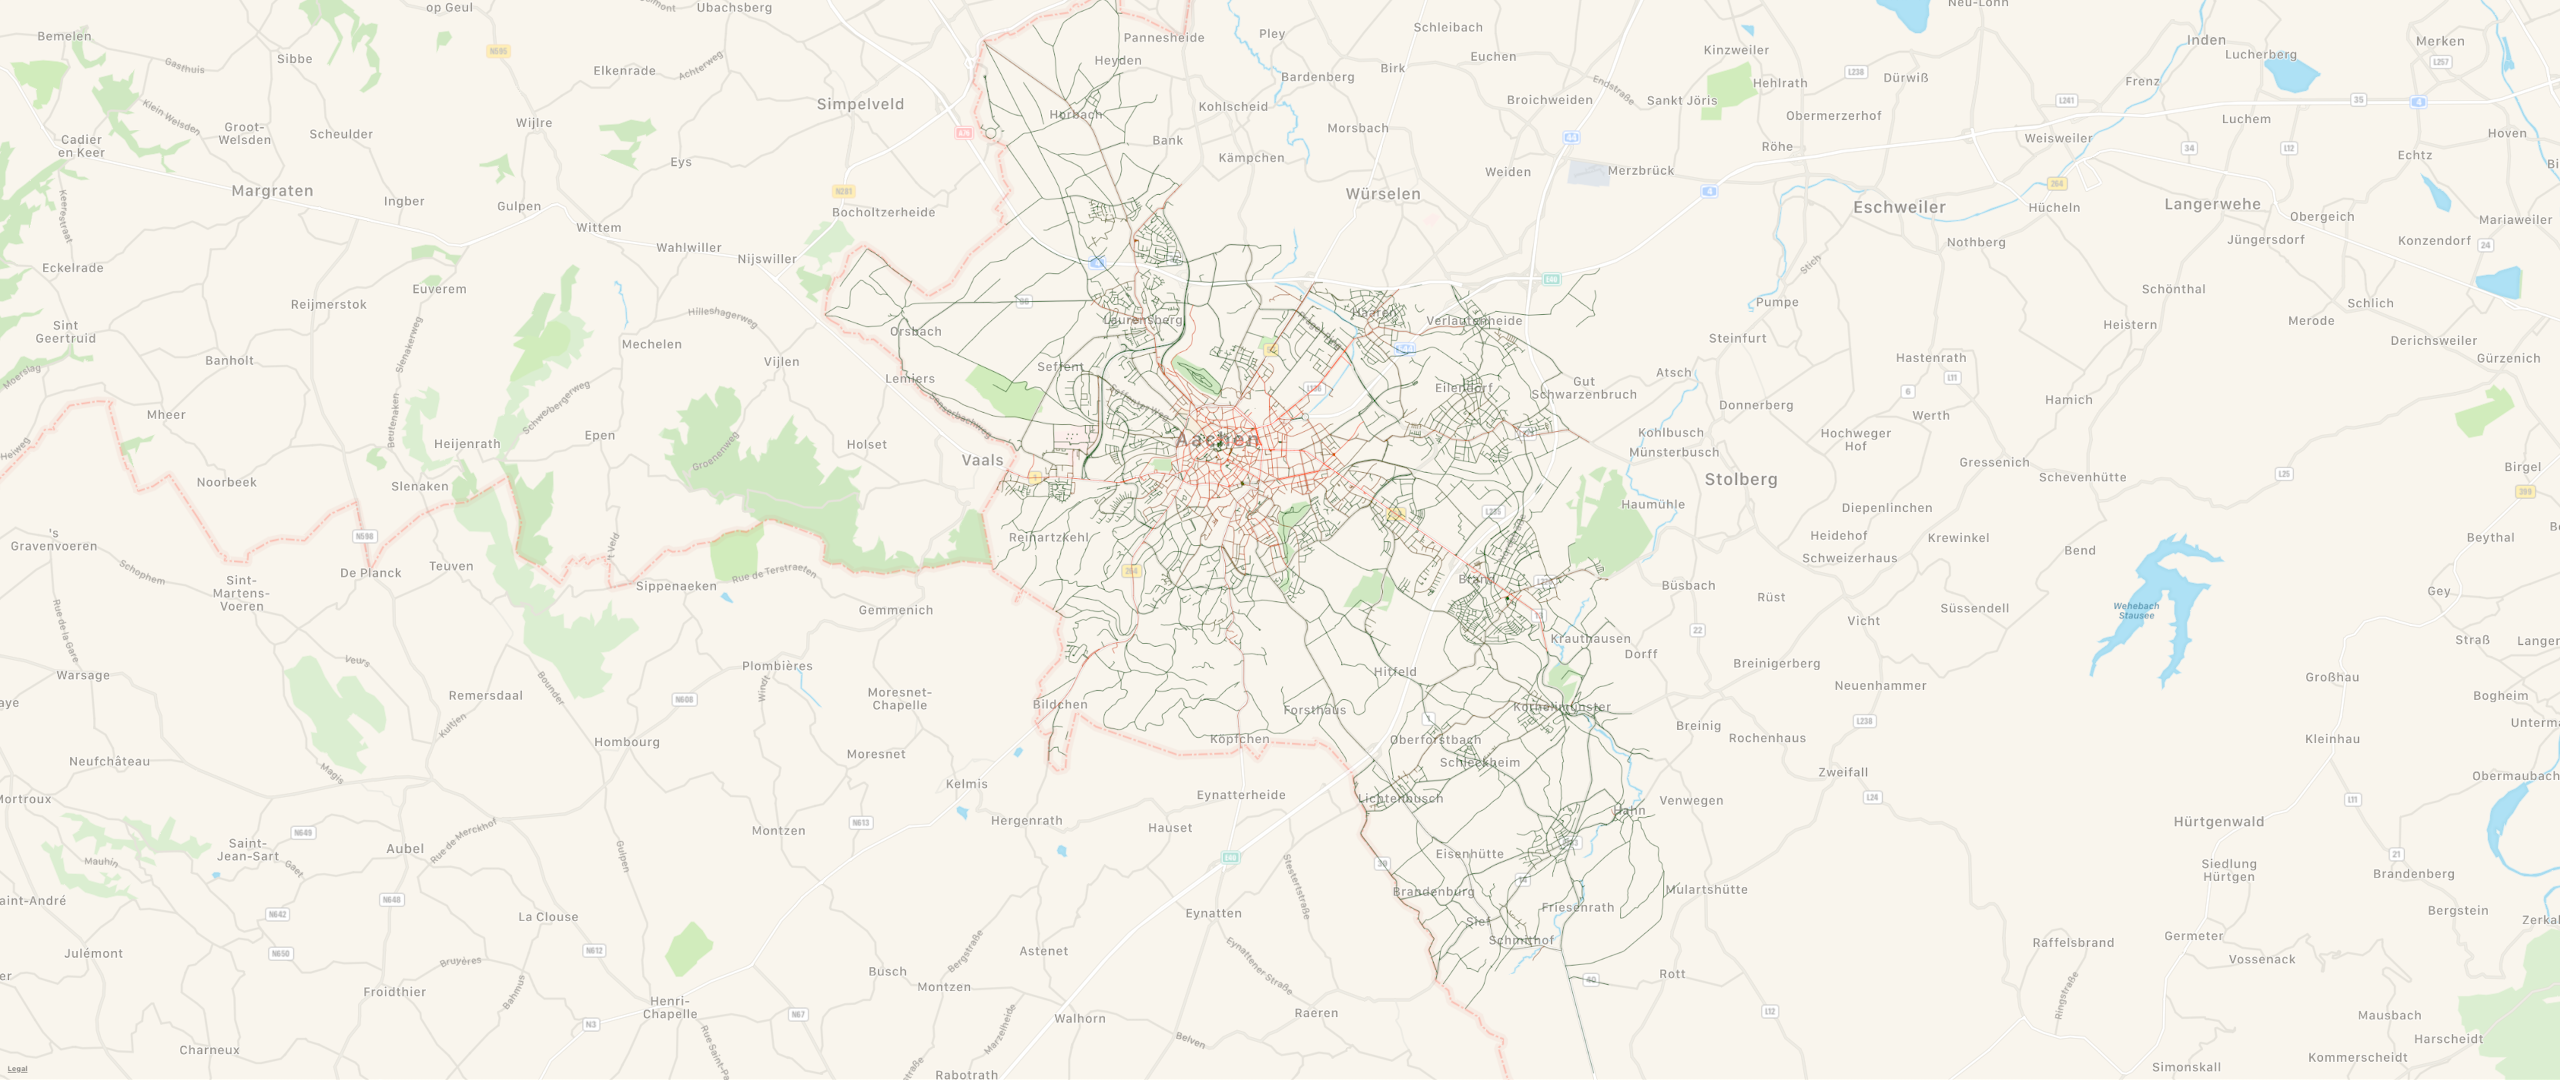
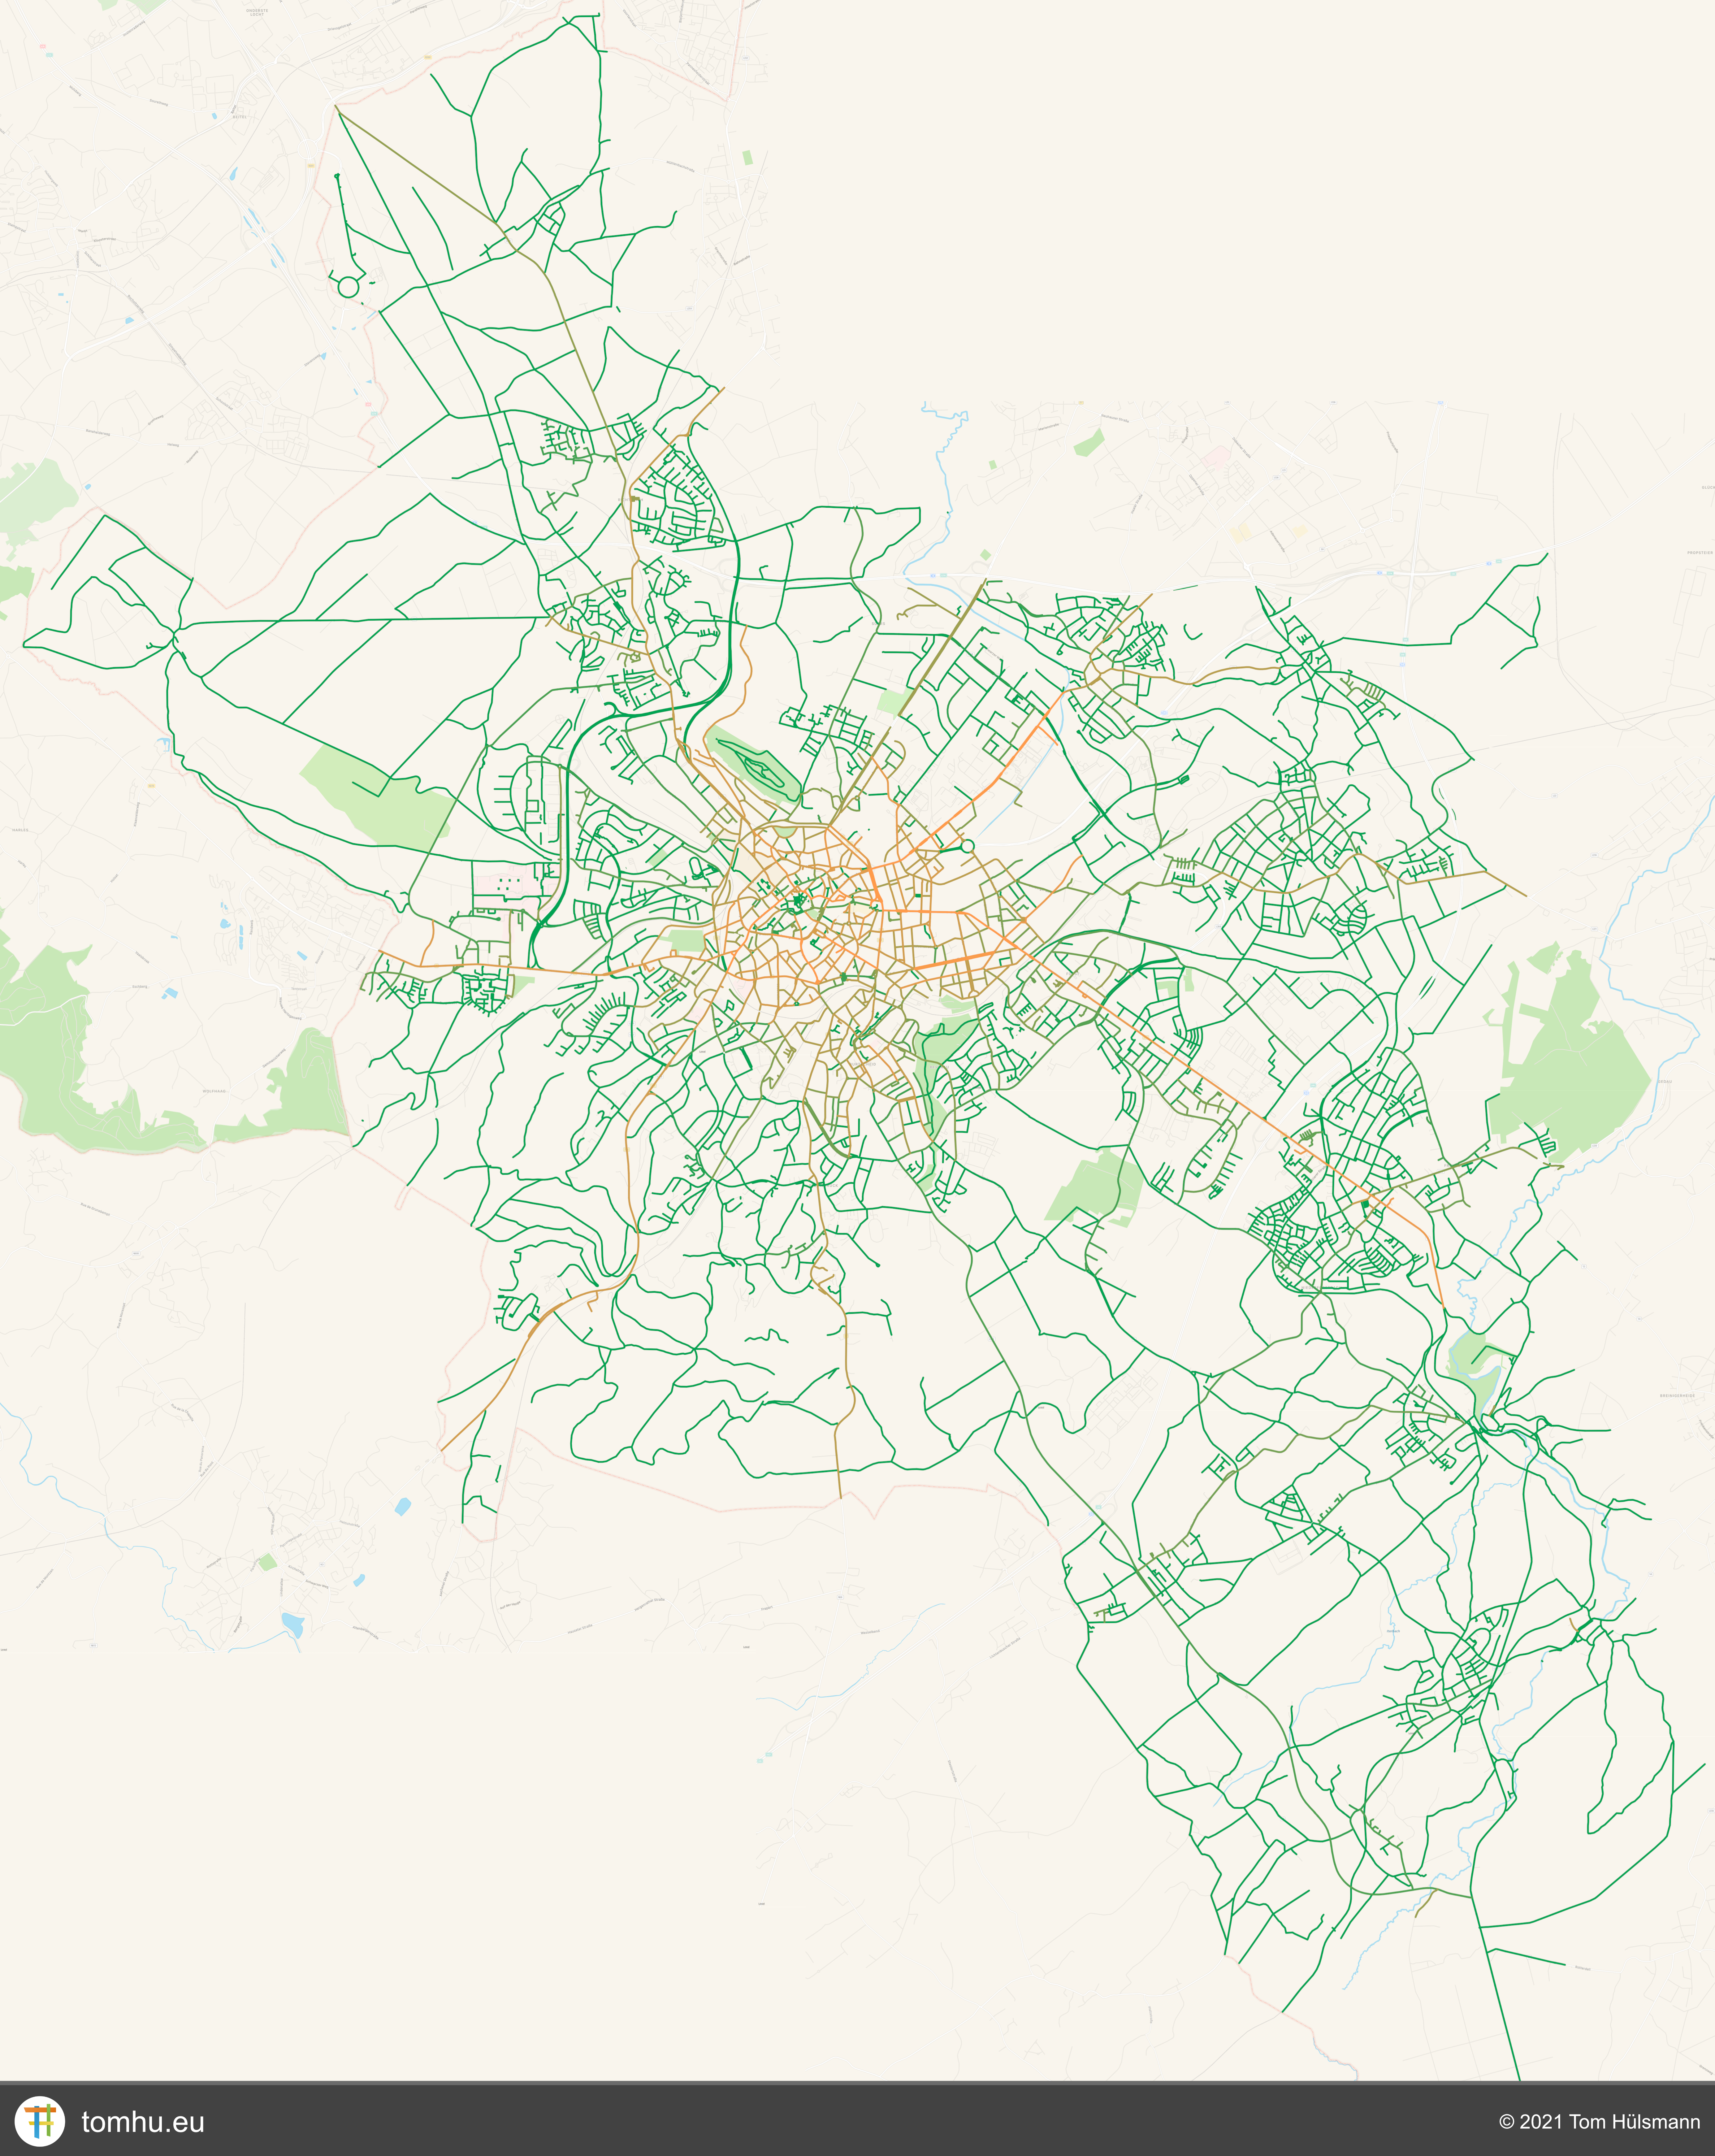
Since that was really slow, I made some optimizations and everything was now finally working! Success! For each street in Aachen, I now had the information on how many parking tickets were issued on that street in 2020. Add a nice little color gradient, draw the streets on the map and done! You can see excerpts of the result above and below.
As one would probably expect, there are more parking violations in the city center and on the main roads. The farther from the center you go, the less violations there are. It has to be noted that each street is seen as a whole. Because the Openstreetmap data I used does not contain information about house numbers, a parking violation is counted for the whole street and not at the exact location. This explains why the long main roads that go from the city center all the way to the suburbs, are red all the way. Also, longer roads will of course receive more violations and I do not normalize for this at the moment.
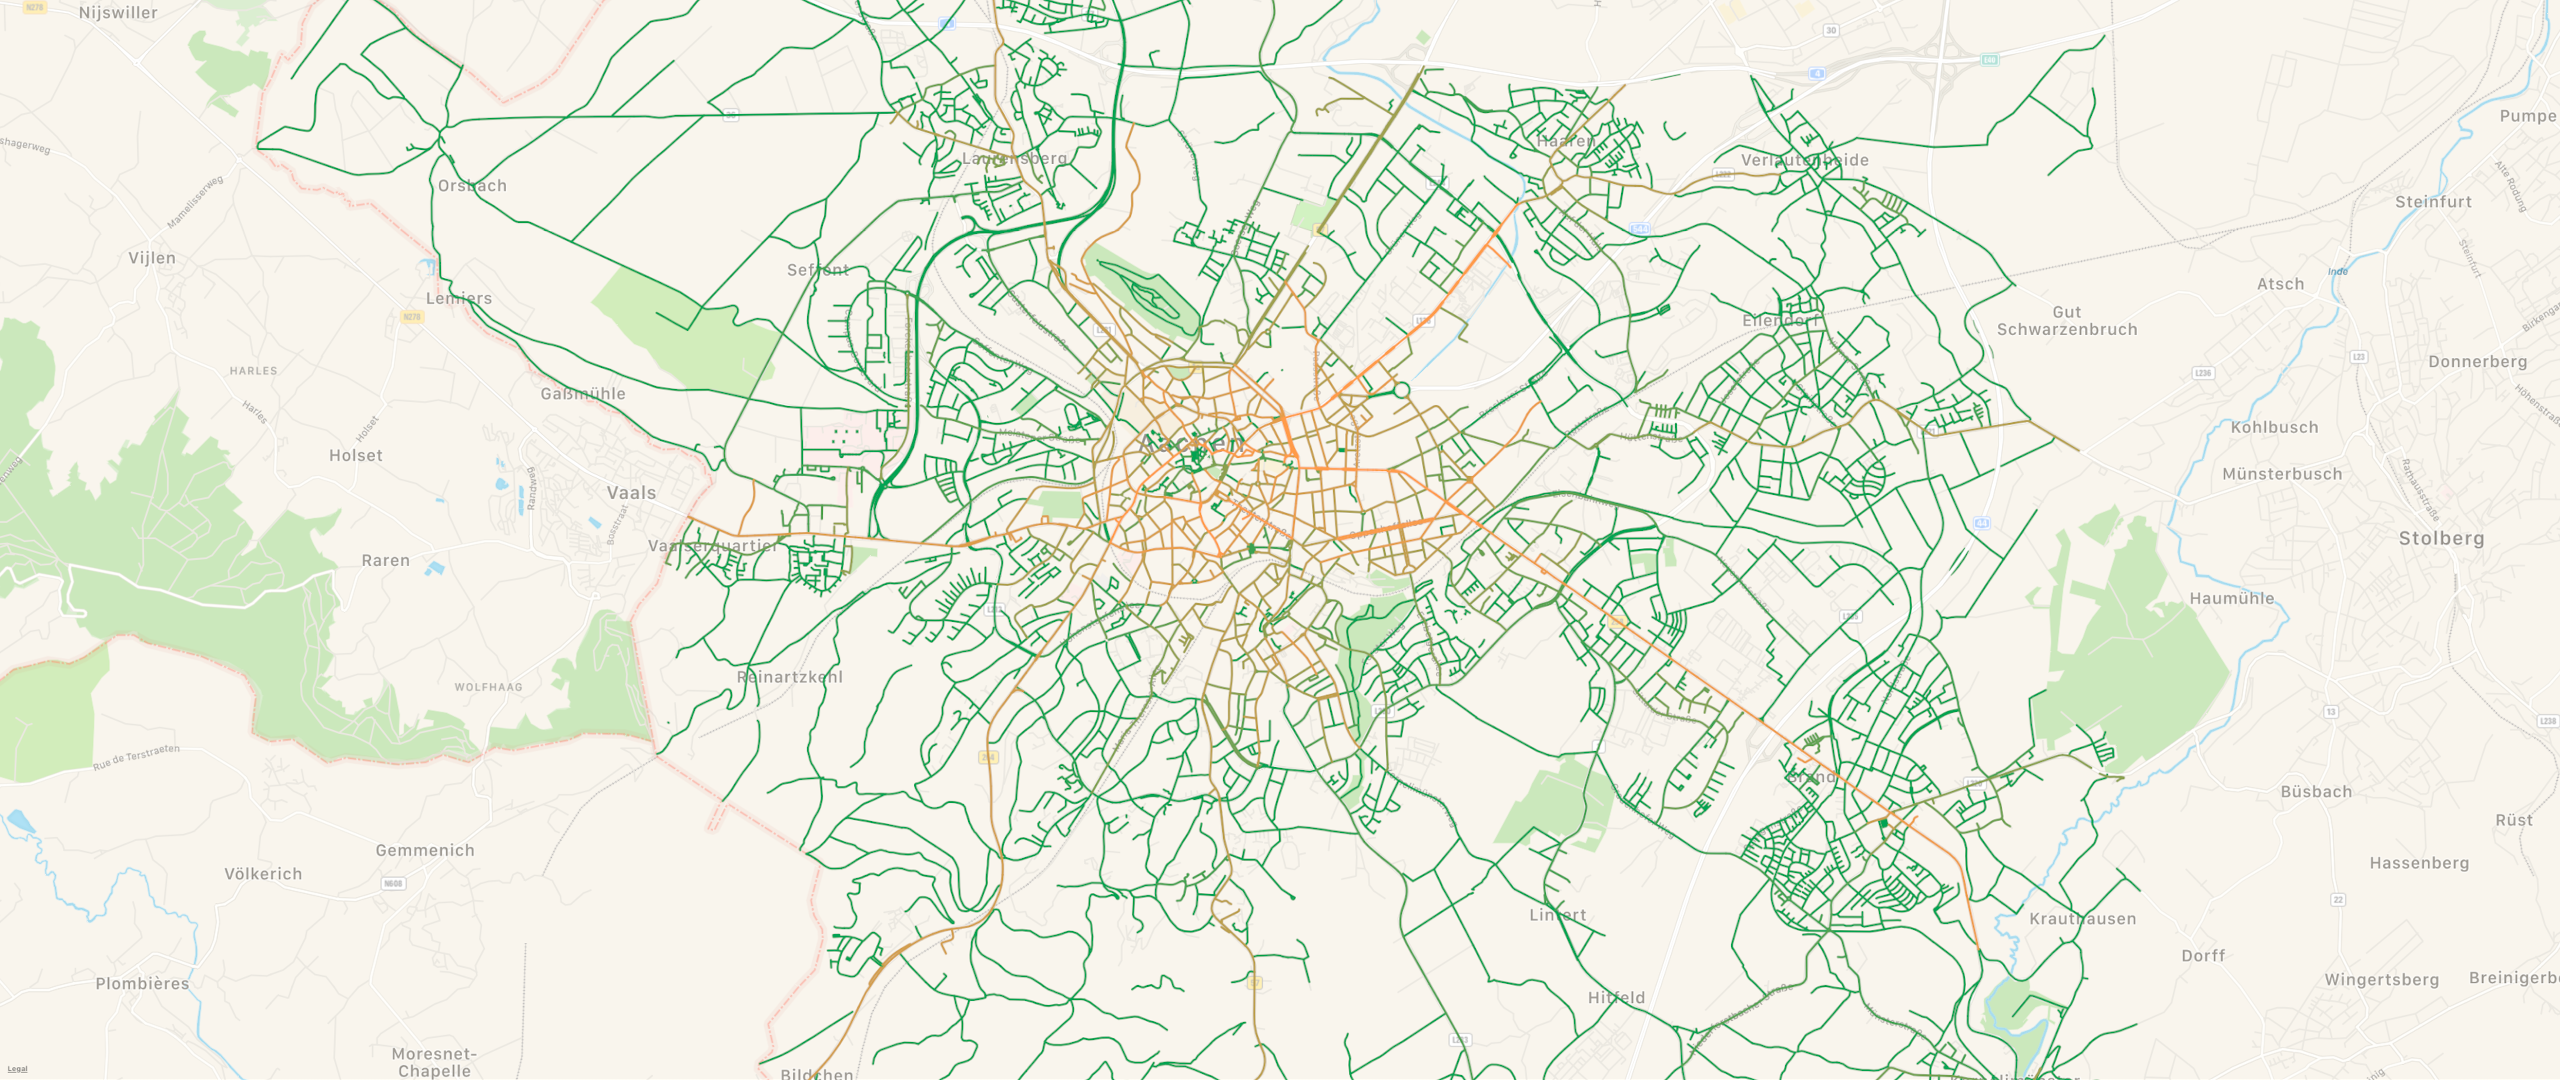
I also considered the fine amount separately. In the above map you can see which streets generated the largest amount of money. This is very similar to the map that only looks at the fine count. Sadly I was not able to find any big deviations between the two maps. It would have been fun if there was a street that creates a lot of income compared to the number of fines. Maybe someone should look into that again… I do have some other fun-facts for you though:
- The city of Aachen has collected 2,626,475 € of parking fines in 2020
- There were 164,493 parking violations in 910 streets (0.7 / resident)
- 701 streets had not a single parking violation in 2020
- The largest amount of fines were collected on the Adalbertsteinweg - totaling 77,736 €
There is a lot more to explore in this dataset, but this should suffice for now. Huge shoutout to the city of Aachen and especially to the team of the open data portal! It’s great that data such as this is provided to the public in a simple and accessible way. Keep up the good work!
| You can find a very high resolution version of the complete map here. |
If you have any remarks or comments, join the discussion of this post on twitter.